Using Perfview in Dynamics 365 for Finance and Operations
PerfView is my favorite .NET profiling tool. It uses ETW to collect performance data.
This post starts series on working with it for Dynamics 365 for Finance and Operation optimization tasks.
Currently we have following posts:
- Introduction - this post
- Collecting a trace
- Wall clock analysis start
- Bottom-up analysis
- How to analyze X++ etl in perfview
Why do I like PerfView:
-
It it is very flexible: it can answers questions like “what are the most resource consuming functions from the code under my control”, “what are the most consuming function from modules that are level below”, etc.
-
It has rich (but not very intuitive UI) - flexible grouping, flamegraph, etc
-
It can collect data on the whole call stack (including AOS and ODBC calls).
-
It can accept data in an easy to understand XML format, that can be writen by tools under my control (for example, in the Electronic Reporting module for Dyn365FO 7.3 we can collect and output trace for configurations without exposing other user’s data)
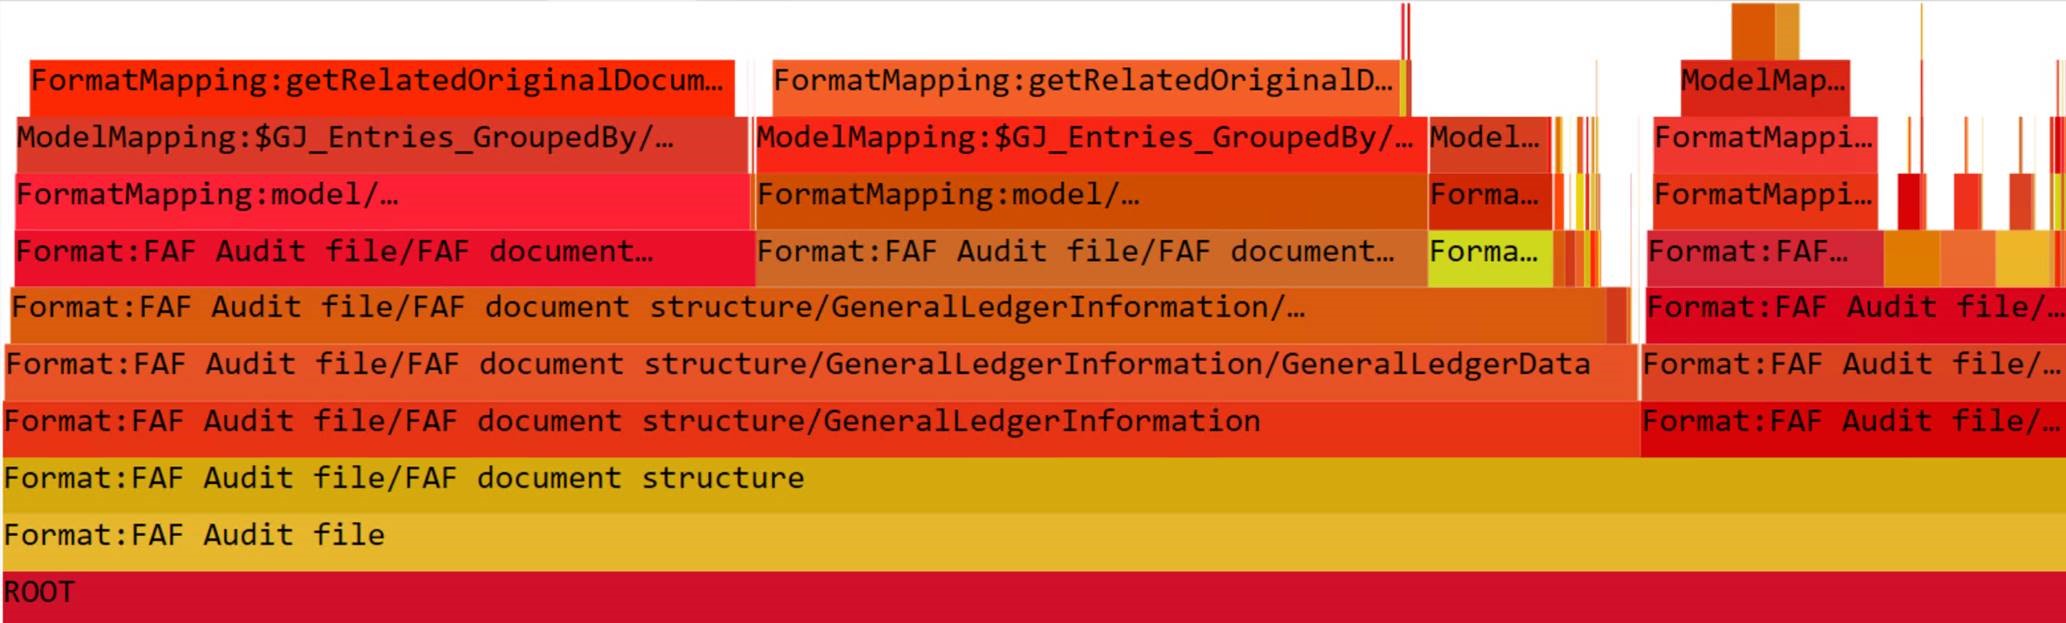
Perfview showing flamegraph for ER configration:
Perfview vs traceparser
What are upsides and downsides of using PerfView vs Trace parser?
For me the main downside of PerfView in comparison with TraceParse is that it is unable to include SQL queries in the call stacks. While it can work with custom ETW providers, I still have not found a way to show SQL queries data there.
Second, it is not integrated in the Dyn365FO so, you need to access particular box to collect the data. You can collect trace from Dyn365FO UI and use it in tre TraceParser, but for collecting Perfview trace you need to install PerfView or collect .NET related ETW events some other way.
Third, the PerfView UI needs to be adapted to.
How to collect data with perfview
The main sequence of steps to collect data is following. I hope I will cover each step in details in the future:
-
Determine a resource that limits performance (you can use other tools like resmon for that). If I don’t know, where is a bottleneck, I collect a thread time first, and then use the wall clock analysis to see what resource is limiting scenario performance.
-
Collect data targeted to bottleneck. Mostly in my practice there are 2 cases:
- The scenario is CPU bound - “w3wp” or “batch” proceses use CPU up to 100% of one core and other resources wait for those processes to complete the task. In this case better to collect CPU usage because wall clock data can be inaccurate and affected by random factors. Also you will not have to deal with selecting the thread, which you want to analyze.
- The scenario is IO bound or waiting for other processes to complete (for example sql server executing query). In this case better to collect thread time and prform wall clock analysis.
- Perform top-down or bottom up analyze. You can use rich grouping and folding capabilities PerfView provides, flamegraph, call trees, etc.
Useful links
- PerfView has embedded html documentation.
- Channel 9 contains old, but very usefull series of videos on PerfView - PerfView tutorial
- Excelent video by Sasha Goldshtein from DotNext SpB
- Using ETW to profile and fix PowerPoint presentation