Perfview in Dyn365FO. Part 4 - Bottom up analysis
How to find hot spots in your code.
See the First part for the introduction and a list of posts.
Overall plan
When I do a bottom-up analysis the questions I am intereted in are the following:
- What resource is the bottleneck – this one was discussed in previous post
- What parts of my code eat most time/CPU – so I can optimize them or reduce their usage
- What parts of underlying platform consume most of resources - I can not change them directly, but I can reduce their usage or change this usage somehow or ask an owner to optimize that code.
So, most time I do the bottom up analysis then I do the top down analysis of a hotspot then I decide how to optimize it.
How to find a hot spot
Actually I am inetested in 2 levels:
- My code (code I can change directly)
- Code I call
PerfView can show very deep details of code execution, including windows kernel functions and ODBC calls, but for quickly finding bottleneck these details are too many.
Fortunately, the tool have 2 very powerfull features: grouping and folding:
- Grouping allows to combine data from several calls into one (for example, you can summarize calls by class name and have total time for calls of specific class).
- Folding allows distribute statistics of some kind of calls to usages. For example, if I see that on the top of statistics there is some common operation like adding strings, I can fold it to see the whole picture - calls of this operation will receive it’s time and operation will disappear from view.
Therefore:
- If I want to see statictics of the bottom level of my code, I:
- group modules of my interest by functions
- all other code group to a single path “Other”
- fold the group “Other”
- See what parts of my code consume the most time
- If I want to see statistics of underlying code I do the same steps but “entry group” the group “other” - than means that PerfView will group by calls that are entry point to the group (so internal details of all other calls will be hidden, but I will be able to see, what specific calls of other code consue most time). In that case folding is not required.
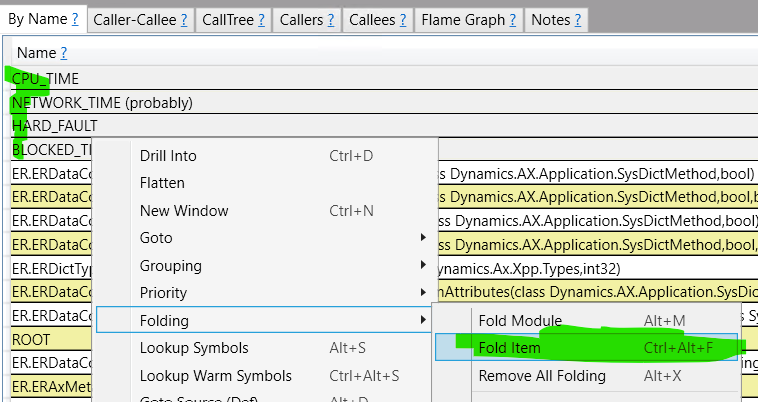
How to use folding and grouping in PerfView
Quick demo
I want to profile and found of bottleneck in the loading of moodel mapping designer
- I collect a trace for the wall-clock analysis
- I open the trace, select w3wp process and open the “Thread Time” view
- I select “No grouping” in “group pats” and try to find thread in the “CallTree” tab: just enter “modelmapping” in the “Find” input box:
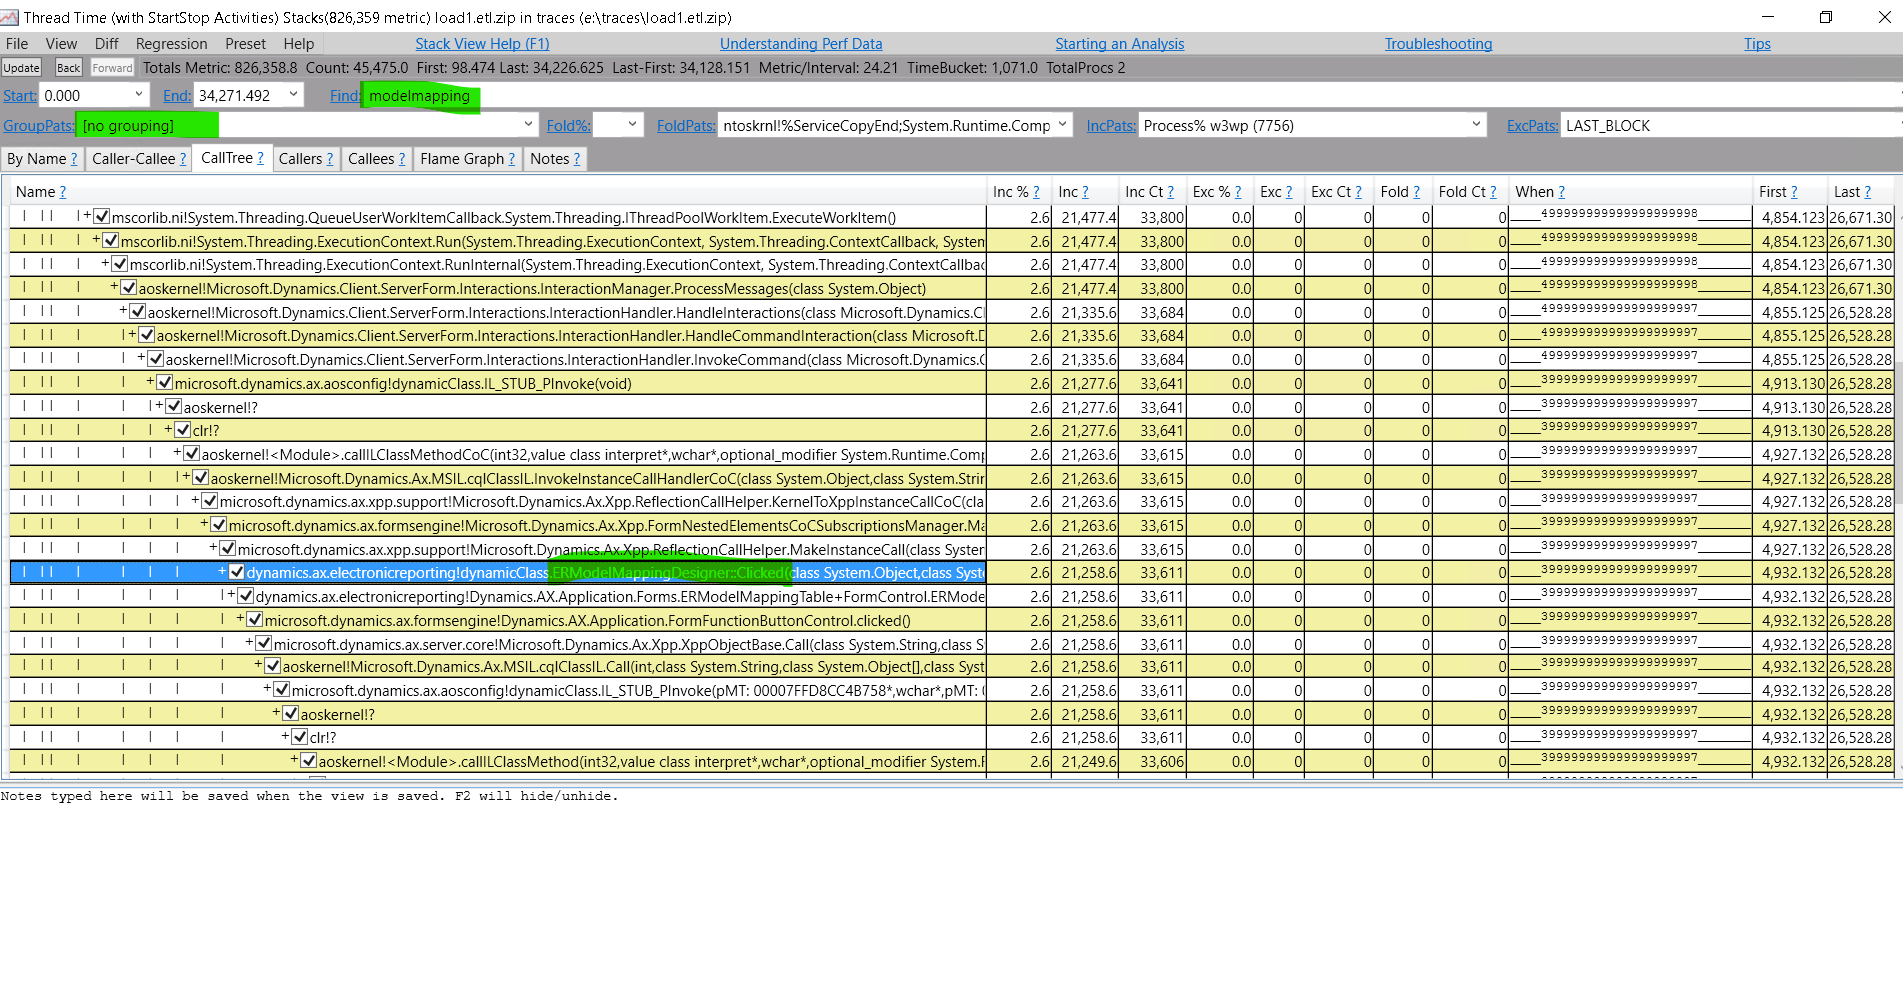
- Now I see that find right thread (with ERModelMappingDesigner::Clicked) I can right click on and select “include item” and I will see only the thread I inetersted in, but I after that I edit the “IncPats” slightly - remove module name and arguments (will explain later) so I will have something like “Process% w3wp (7756);ERModelMappingDesigner::Clicked”
- Then I switch to “By Name” tab:
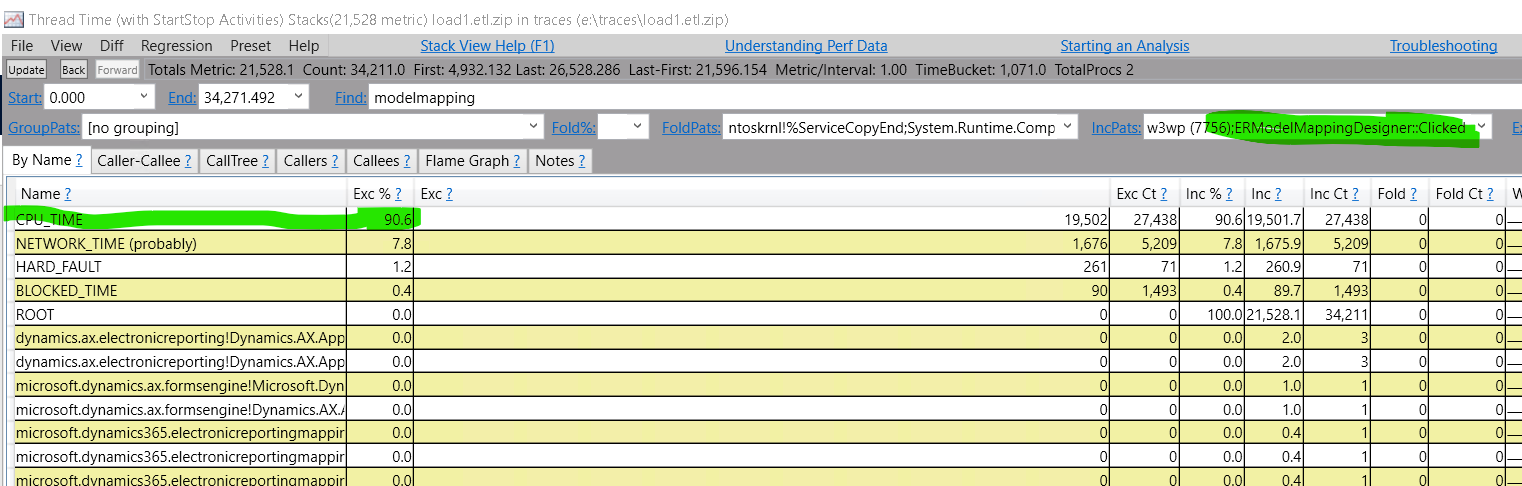
- I see than the process is CPU bound and can double click CPU_TIME to find a reason (pressing checkboxes in the tree):
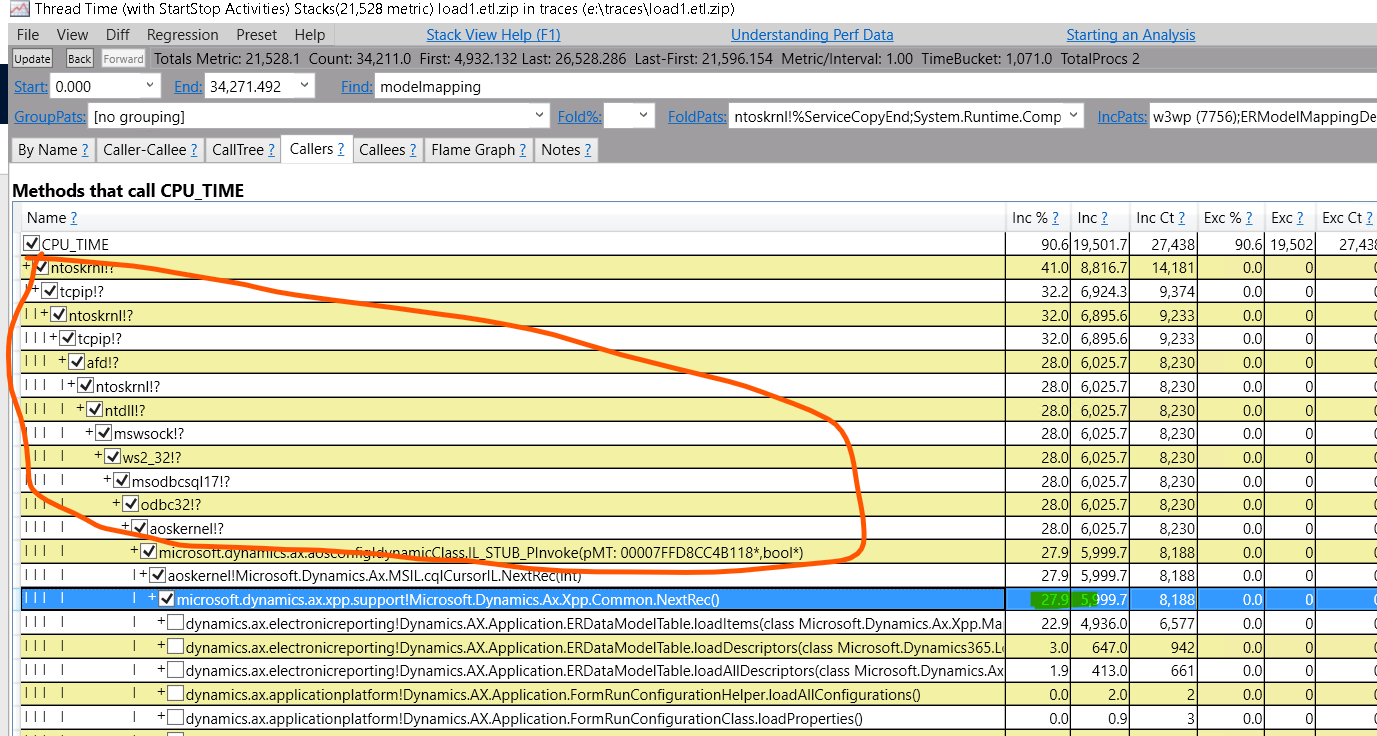 but most of levels beween CPU and my code are unnecessary - I want to see the big picture.
 - So I apply grouping rules I prepared (load it to Presets, and select from presets ER -> Other)
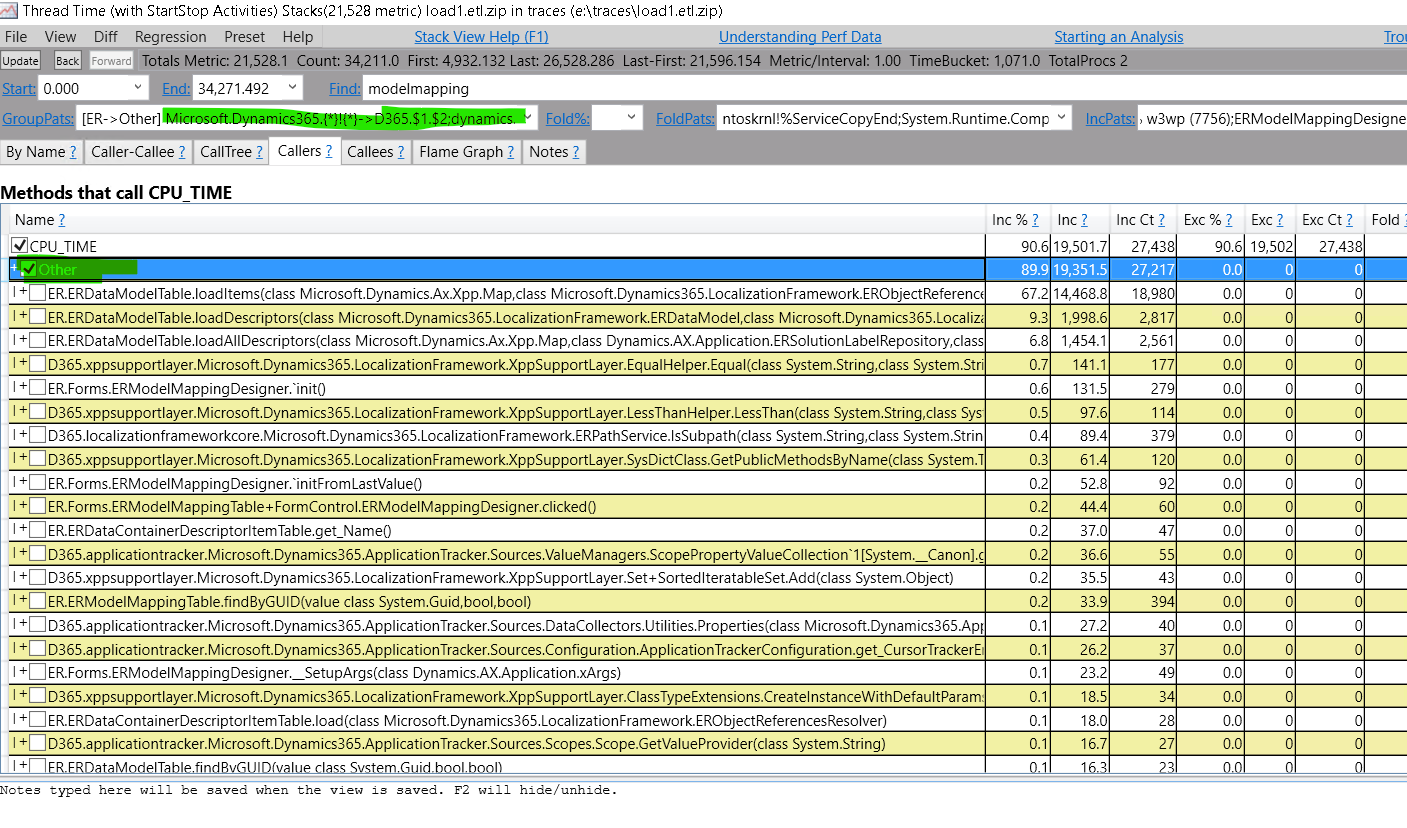 and repeat selecting CPU and see that all unnecessary details are grouped into node “Other”
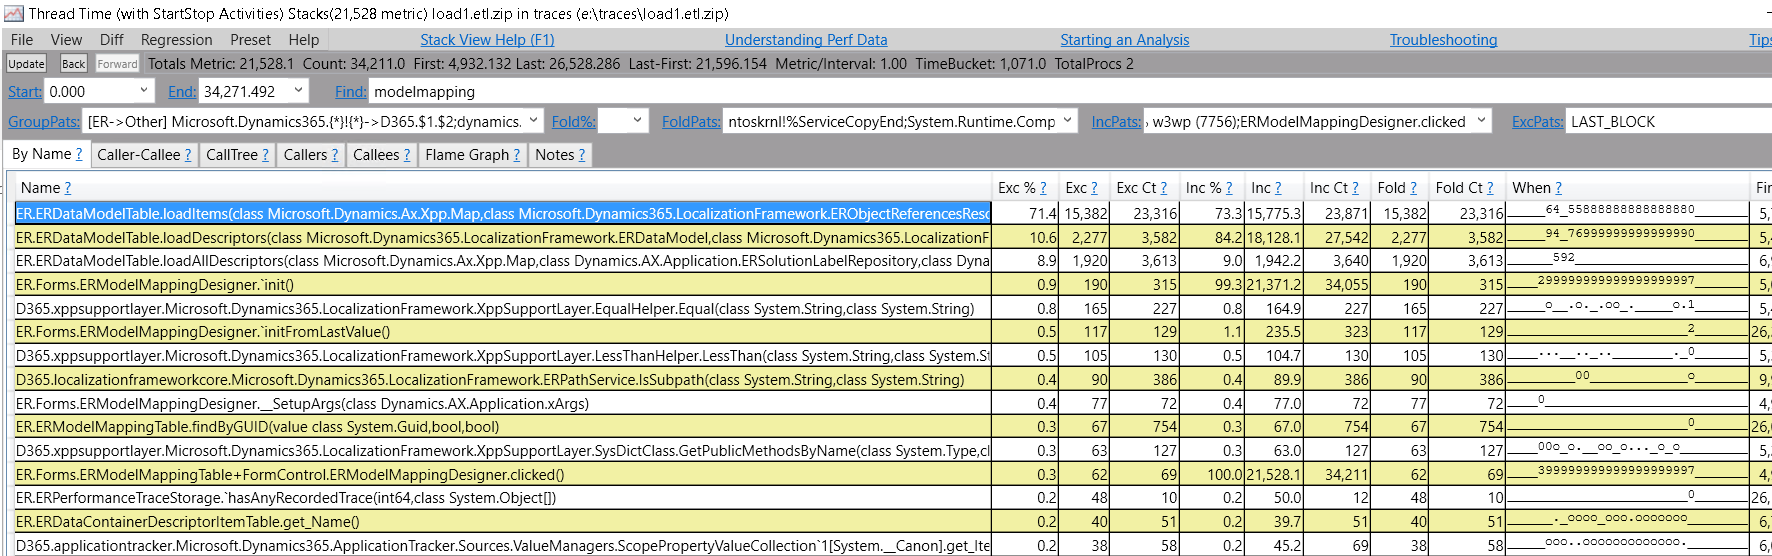
 - Now I can switch back to “By Name” and fold all the ow level items including “Other” (folding means that item’s resources will be distributed across callers)
- Now we see a bottleneck and can optimize it (for example ungroup and perfrom a top-down analysis starting with the node)
- Other way is to look just under my code and see what calls of underlying platform eats much time: just switch to “ER => Other” preset (then unfold all and fold cpu):
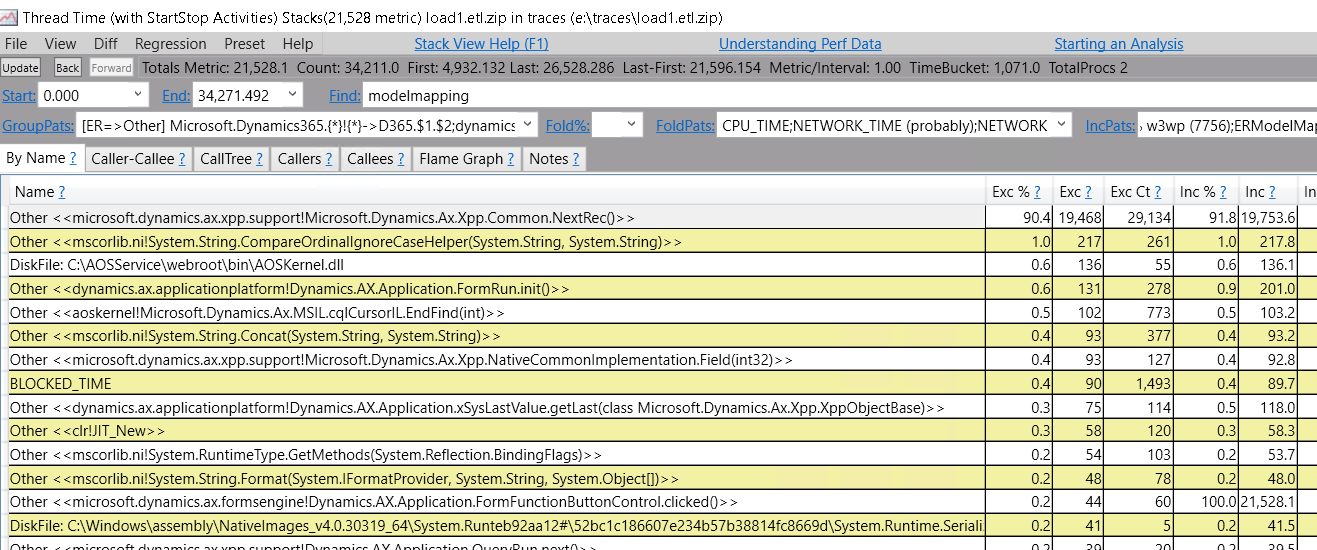
We see the most CPU time spend for moving between records - double clicking on the top row can show callers.
Explanation of grouping presets
I have 2 presets:
- “ER -> Other” groups all modules I interested in by methods and all other item are grouped into single group named “Other”
- “ER => Other” is the same thing, but performs entry grouping for other cals - that means that all methods from external code will be grouped only when my code calls it, all internal calls between external code will be inside those entry groups.
Grouping syntax
This is my example (download presets file)
[ER=>Other] Microsoft.Dynamics365.{*}!{*}->D365.$1.$2;dynamics.ax.applicationsuite!Dynamics.Ax.Application.{*}->AppSuite.$1;dynamics.ax.electronicreporting{*}!Dynamics.Ax.Application.{*}->ER$1.$2;!=>Other
Explanation:
“[ER=>Other]” - a name of the preset
After the name goes sequence of grouping instructions, each intruction groups some type of paths and after that result is processed by the next instruction.
Grouping instructions are in the following form:
Microsoft.Dynamics365.{*}!{*}->D365.$1.$2;
where:
- “Microsoft.Dynamics365.” - this is just a string to match - {*} - is like a .* regex matches any sequence of any symbol
- ! - in the method path it delimits module (dll) name and a method name
- -> is grouping (=> entry grouping)
- $1, $2 - like in regular expressions substitutes matches in corresponding curly braces
So if this intruction will meet string Microsoft.Dynamics365.Application!MyClass.myMethod it will convert it to D365.Application.MyClass.MyMethod.
Take into account that result does not contain the ! symbol so the alsready grouped strings will not be processed by the subsequent instructions.
The last instruction !=>Other will take all previously onprocessed strings and put it to groups by entry points (or to the single group named “Other” in case of !->Other)