Perfview in Dyn365FO. Part 3 - Wall clock analysis
How to analyze actual time thread spend working or waiting for other threads.
See the First part for the introduction and a list of posts.
First step in analysis is detection, what kind of resource is a bottleneck. In my practice when testing performance on 1 box envinronment, most case is CPU bound tasks:
- On onebox we have a very low latency betwen AOS and SQL server so even if we have lots of queries, they are using CPU, not network or disk
- Dyn365FO X++ code often use lots of small queries instead of one giant query with join - partly beacuse of it allows to use AOS caching, partly because many queries are in a separate methods (like “find”).
- I work on Electronic Reporting module that itself is more like platform then like application code.
- The reason for performance degradation can be locks on SQL server side, so it can be reproduced only with simultaneous work of multiple users
Please keep in mind that test and production is a different environement and use other tools (like TraceParser and SQL server tools) to check whether a bottleneck is onthe same place there or not.
Anyway lets strart.
How to analyze thread time
- Collect a trace with thread time enabled
- Filter by a thread you are interested in
- See the most used resource
- Recollect trace for CPU, if a task is CPU-bound
- Perform top down or bottom up analysis
After you press “Stop collection” and Perfview processed the trace, you will see the following window:
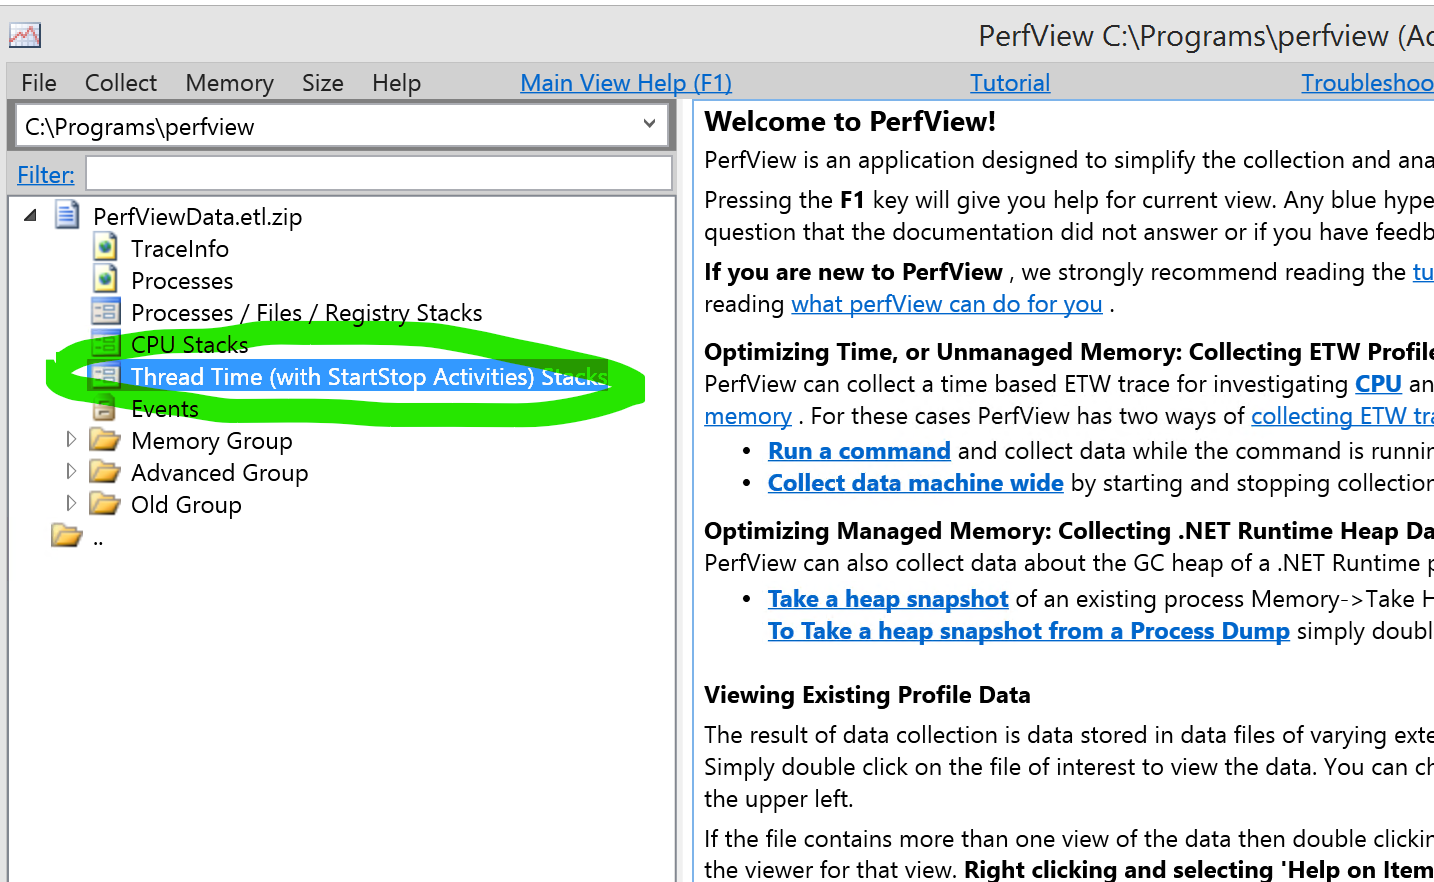
Double click on thread time to select process and see details:
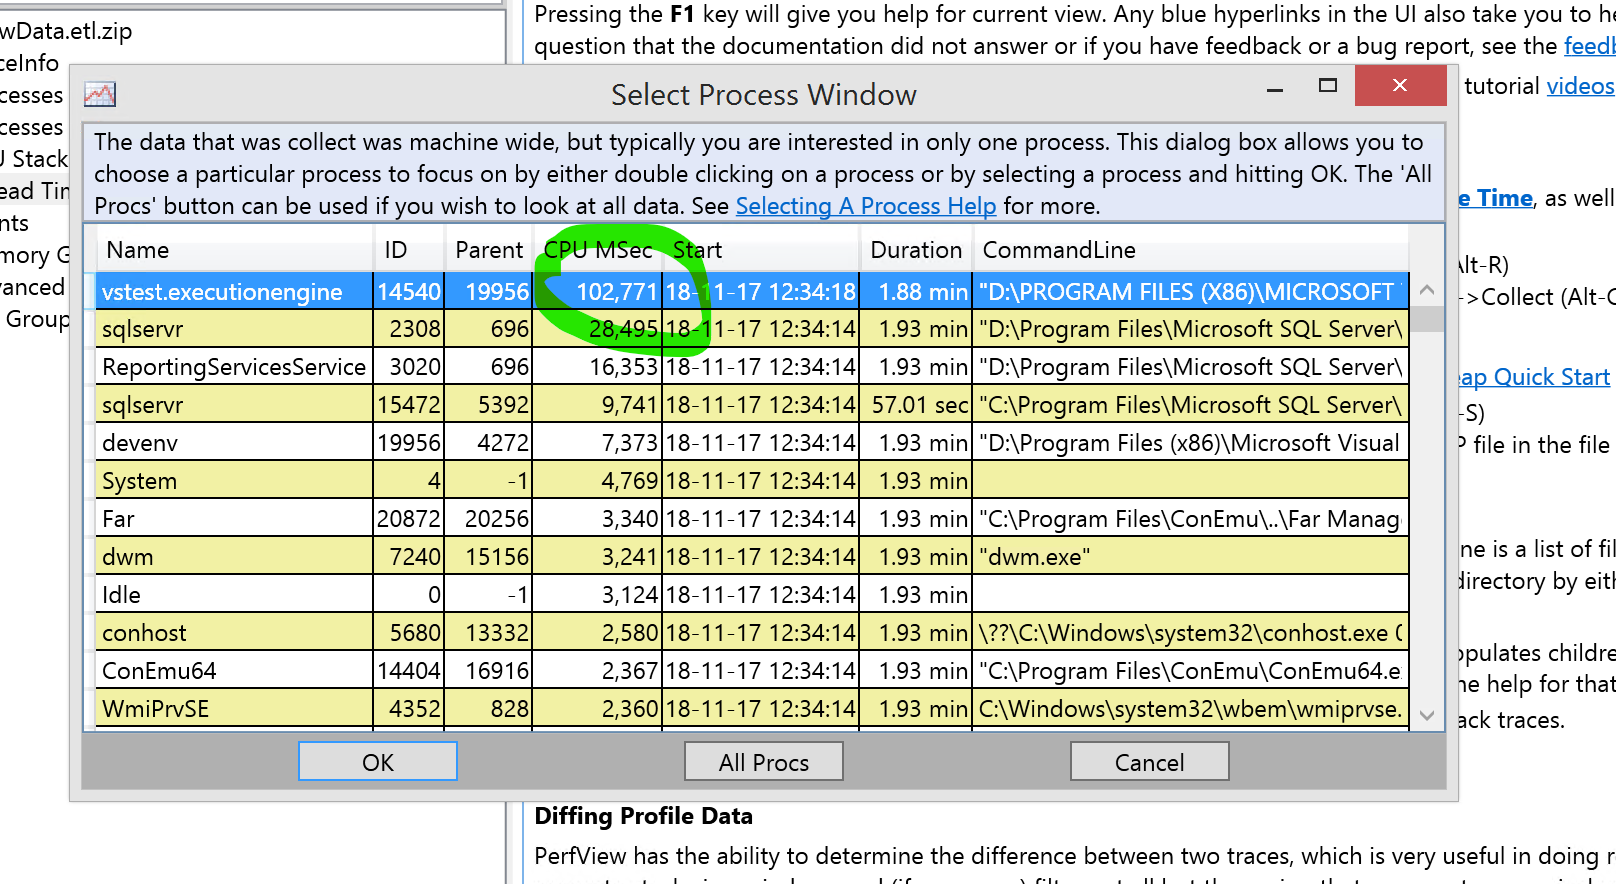
We see list of processes sorted by CPU time used and since I use perfromance test, I see the Visausl Studio test execution engine on top. If you use onebox you can probably see SQL server (if it do the most job). Also you can se AOS (w3wp) batch service.
After pressing OK we will see data for callstacks:
Filtering by thread
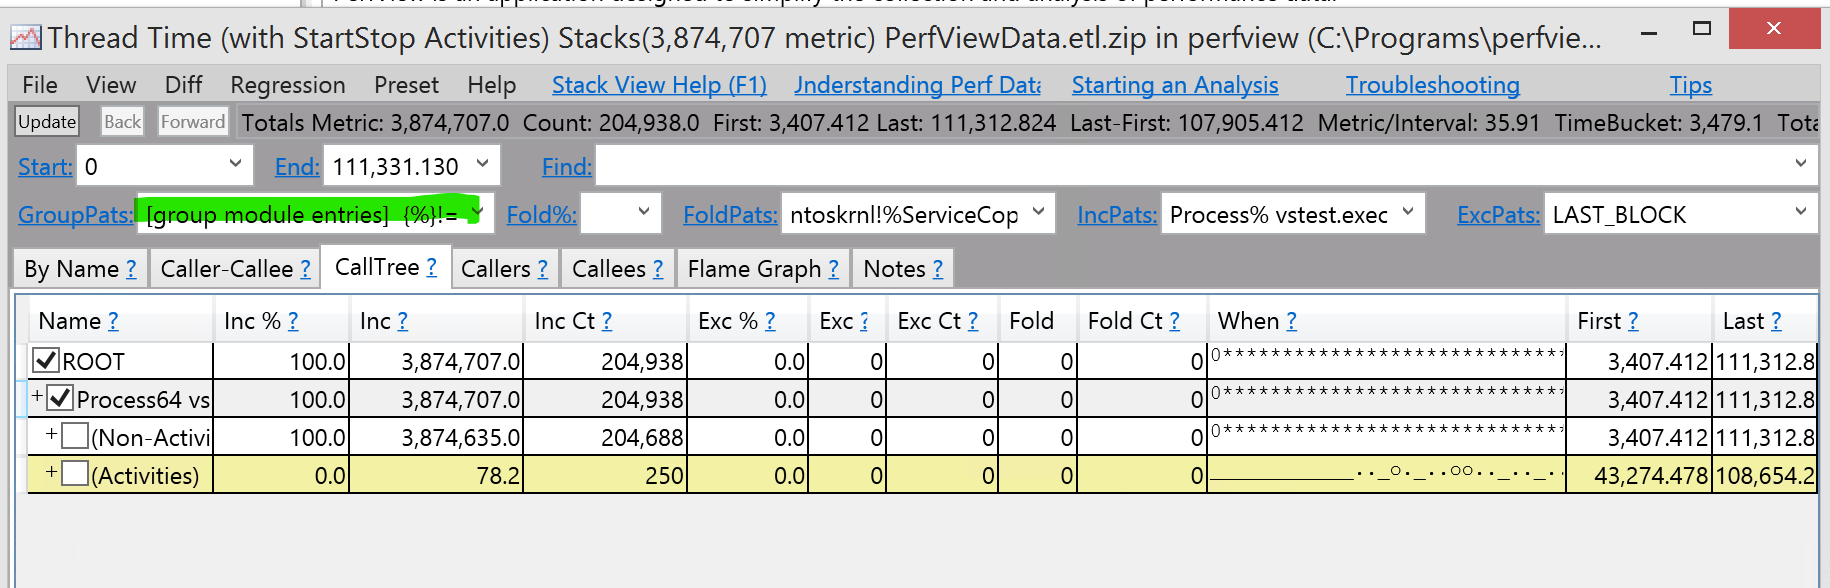
This data is not very useful: since we measuring thread time it tells us all the time all thread spend on working and waiting, but we need to analyze only one thread - that is doing actual job.
Also by default data is grouped by module. For selecting thread we
- Set “GroupPats” to nothing
- Find the thread we actually want to explore: enter in “find” a name of the method that surely exist in callstacks that you are interested in. For my case it is “ERFormatMappingRun.run” and press enter
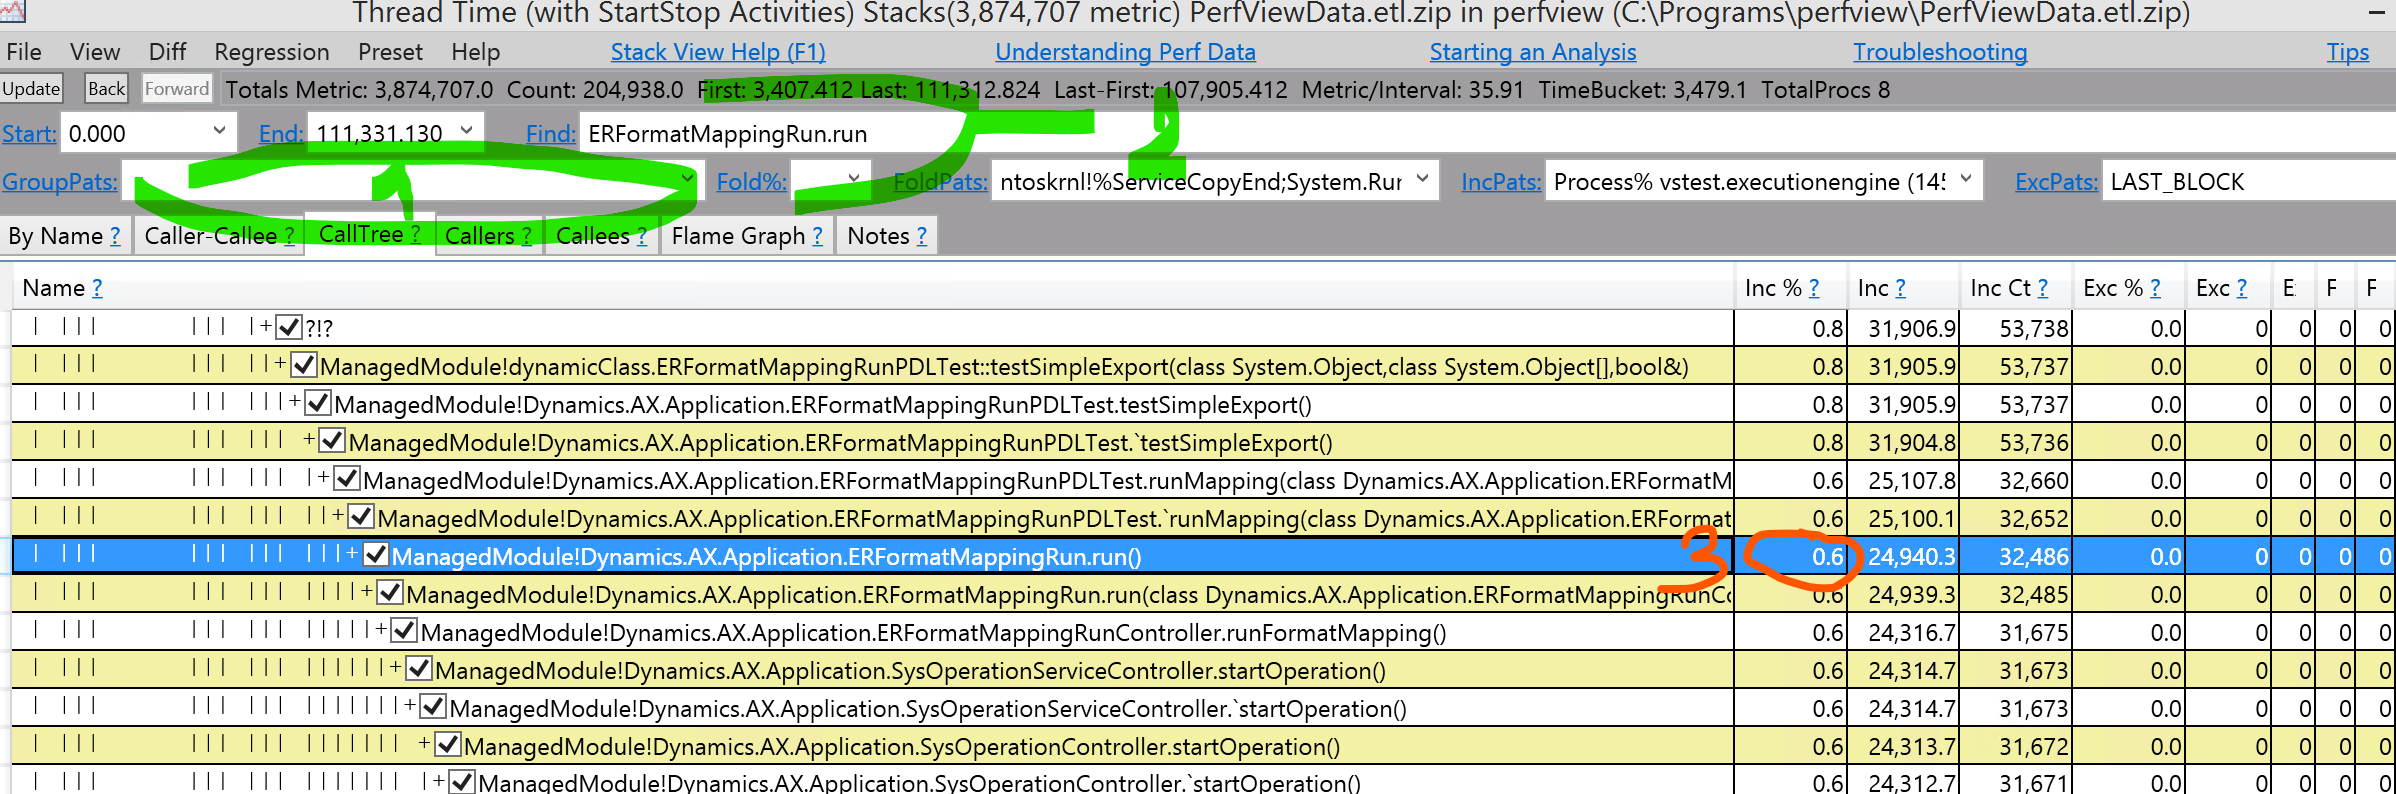
Look at the pt.3 - perfview says that the whole method run is 0.6% of time. That’s because working and waiting time is summarized for all threads and this is percentage from all that time.
Lets tell PerfView to see only stacks that include “ERFormatMappingRun.run” or method of your choice: type “;ERFormatMappingRun.run()” in the IncPats window and swithch to “by name” tab:
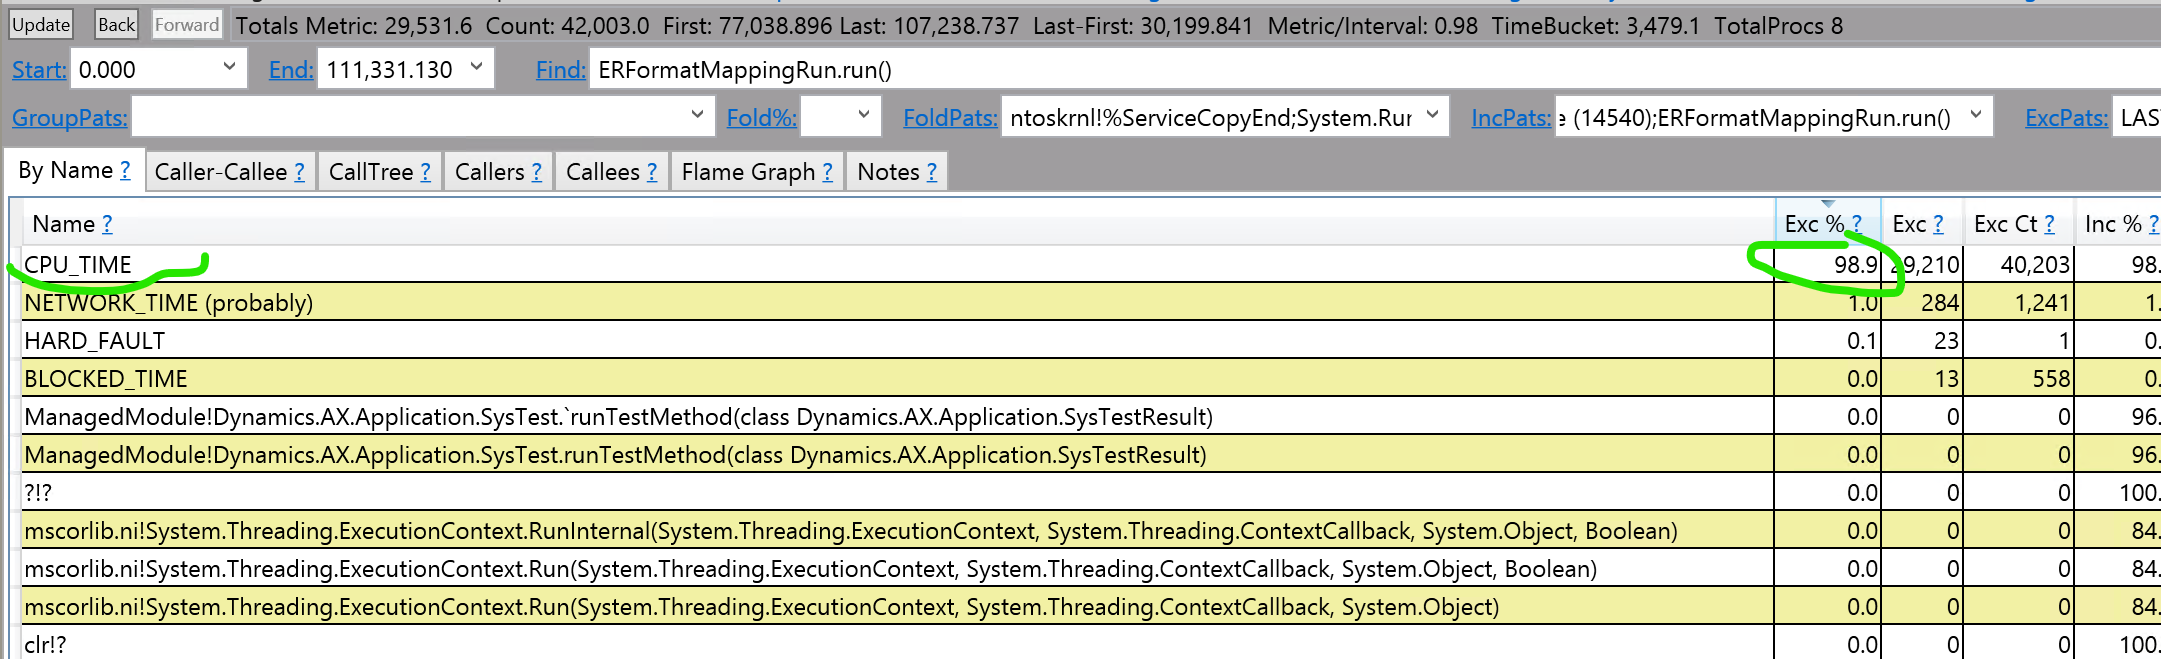
We can see that most time (exclusive %) is spent by CPU - so actually calculating things, not waiting for SQL or network.
The task is CPU bound.
Now you shoould recollect trace for CPU to get better precision. Or, if you have a different result, you can start top down or bottom up analysis:
- Go to CallTree tab and investigate perfromance of different parts from the top
- Or doubleclick CPU and see the callers tree
The later will be difficult since perfview now does not know what are borders of your task and so it is started from OS internals.
But the tool is very flexible and the next time we will see how to group stacks by meaningful properties.