Perfview in Dyn365FO. Part 2 - Collecting a trace
The first step in working with PerfView is collecting data.
See the First part for the introduction and a list of posts.
The overall plan is:
- Prepare the scenario (use ~1-2 mins long period)
- Select what to trace (trace CPU for CPU-bound tasks, trace thread time otherwise)
- Record the trace
Preparing the scenario
First of all, we need to prepare data. Perfview collects samples of callstak, the more samples to collect, the more precise statistics you will get, but trace file will be bigger. Therefore I usually prefer scenarios with duration about 1-2 mins.
Prefview manual says that 10-20 secs would be enough.
Because the samples are taken every millisecond per processor, each sample represents 1 millisecond of CPU time. However exactly where the sample is taken is effectively ‘random’, and so it is really ‘unfair’ to ‘charge’ the full millisecond to the routine that happened to be running at the time the sample was taken. While this is true, it is also true that as more samples are taken this ‘unfairness’ decreases as the square root of the number of samples. If a method has just 1 or 2 samples it could be just random chance that it happened in that particular method, but methods with 10 samples are likely to have truly used between 7 and 13 samples (30% error). Routines with 100 samples are likely to be within 90 and 110 (10% error). For ‘typical’ analysis this means you want at least 1000 and preferably more like 5000 samples (There are diminishing returns after 10K). By collecting a few thousand samples you insure that even moderately ‘warm’ methods will have at least 10 samples, and ‘hot’ methods will have at least 100s, which keep the error acceptably small. Because PerfView does not allow you to vary the sampling frequency, this means that you need to run the scenario for at least several seconds (for CPU bound tasks), and 10-20 seconds for less CPU bound activities.
- If I have shorter scenario I just insert loop into the code
- if I have longer scenario, I either meaure part of it or reduce data to have 1-2 minutes
Also, if you want to compare time, better to make sure that there is no other tasks on the same machine: open resource monitor (Win+R, resmon, enter) and watch for resource consumption.
Also take into account, that possibly you need to measure warm run (so run scenario once before profiling to load caches, etc. But sometimes cold start is also interesting).
Collect the trace
Collection from the command line
You can instruct perfview to collect trace from the command line. For example below is a simple PowerShell script that I use for collecting thread time trace. It starts collection, builds a trace name from a timestamp, and stops collection when Electroinic Reporting finishes format generation (it detects the moment using windows event log monitoring).
c:\programs\PerfView collect "e:\traces\$(date -format "ddMMyyyy_hhmm").etl" `
     -CircularMB:20000 -ThreadTime `
     -NoNGenRundown `
     -StopOnEtwEvent:Microsoft-Dynamics-ElectronicReporting/FormatMappingRun/Stop
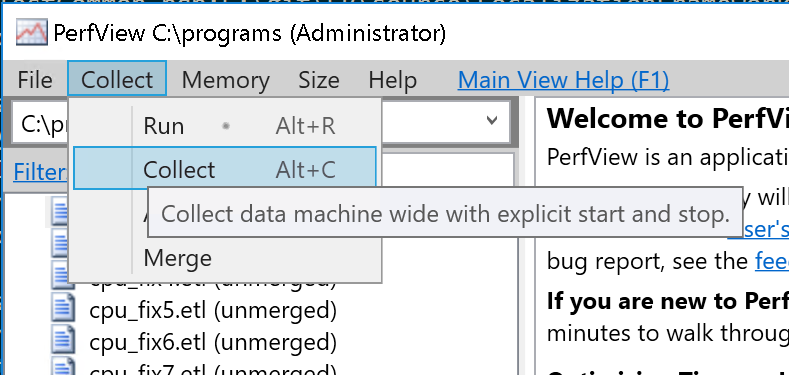
Collection from the gui
- Press Collect\Collect
- Set parameters:
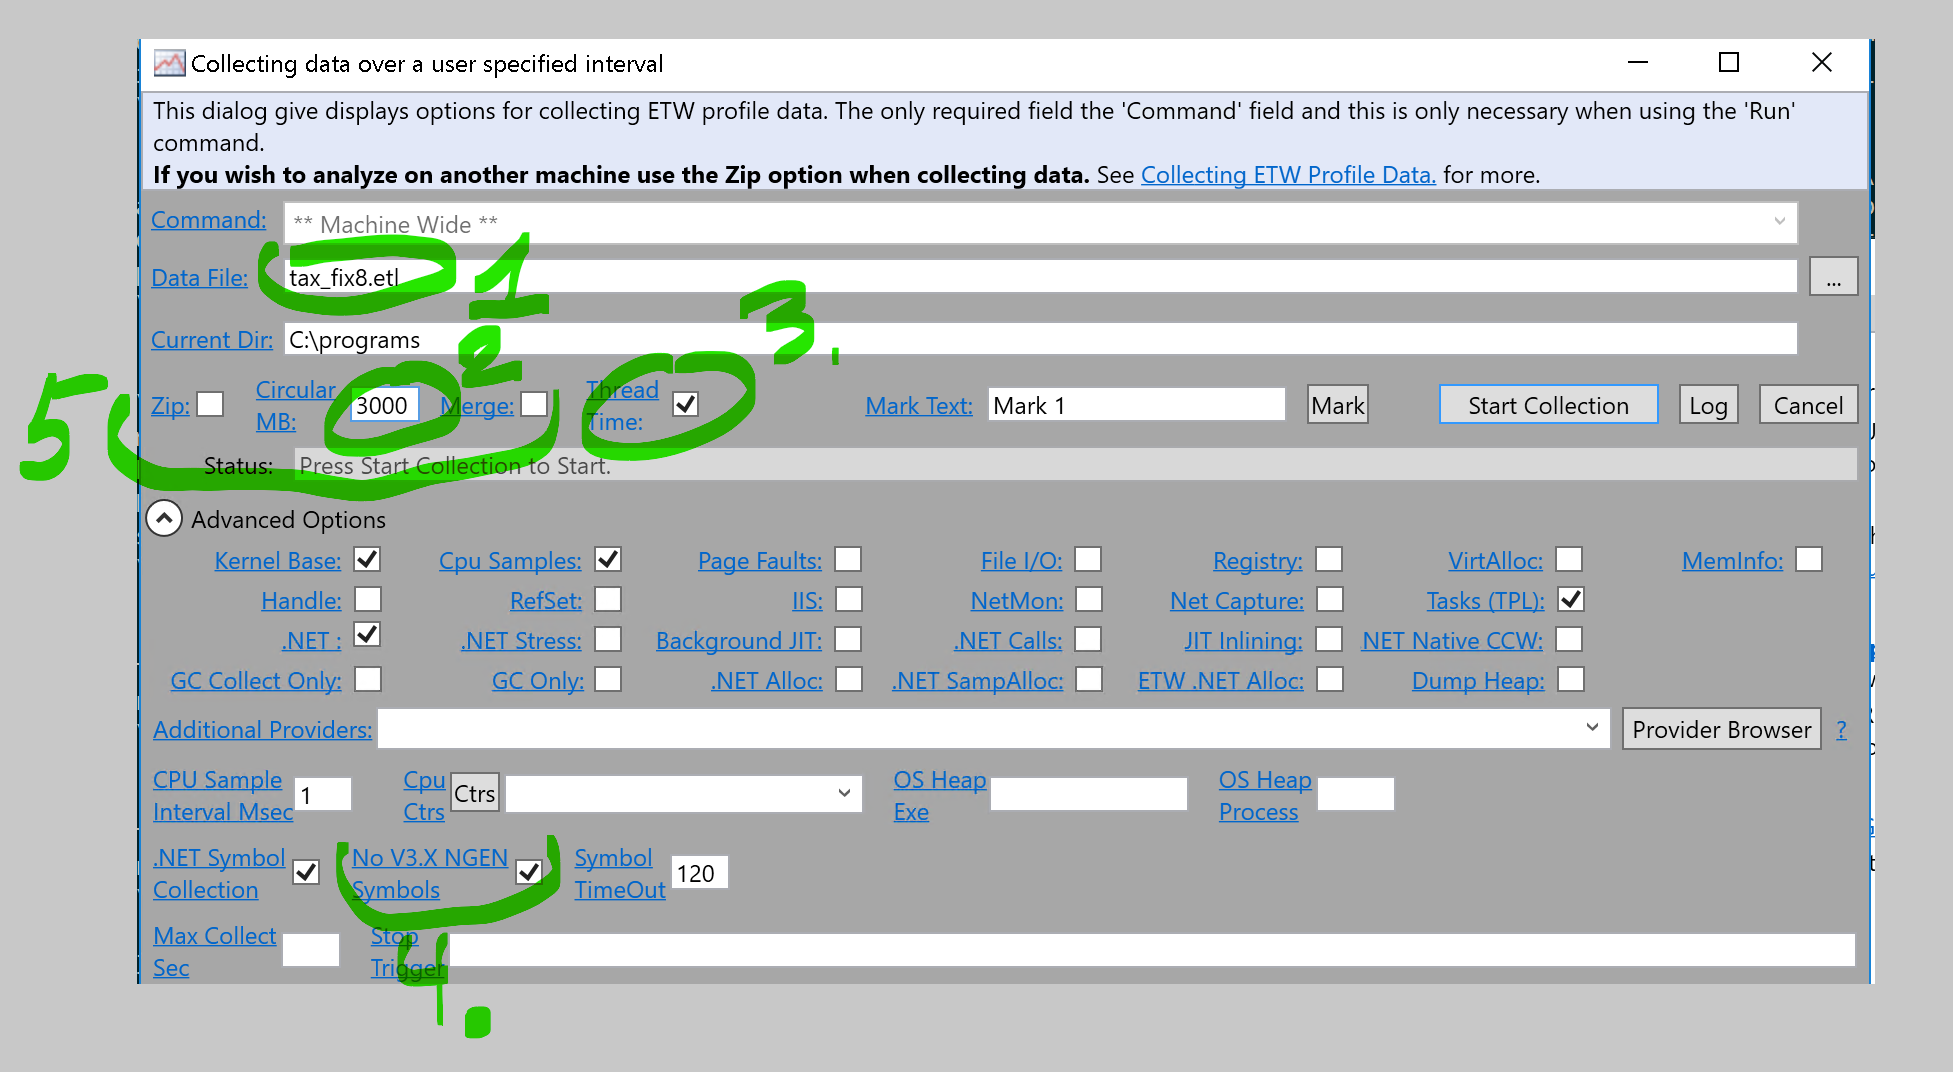
- Name of the trace - set the name that will remind you of optimization phase and type of data (for example “initial-cpu.etw”) it can help to find baseline for comparison of traces later
- Set trace length (1G is enough) - if it is too short, tool wil use it as a circular buffer, so events at start will be lost
- Set “thread time”, if you are not sure that CPU is bottleneck, do not set if you are 100% sure the task is CPU bound
- Set “No V3.X NGEN Symbols”
- Set “Zip” and “merge” if you want to take the trace from current machine to view on other machine (for example, if you have sources and symbols there)
- Press “Start collection”. During collection pay some attention to the trace size
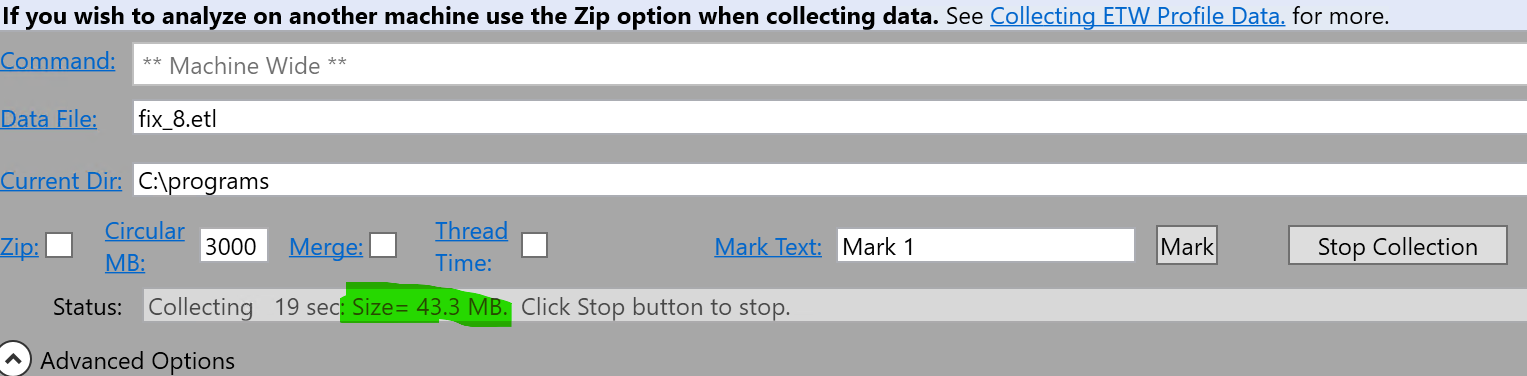
- Press “Stop collection”
Thats all for today, the next time we will start to analyze a trace.